Unit-2 (Short Answer)
a.
With neat
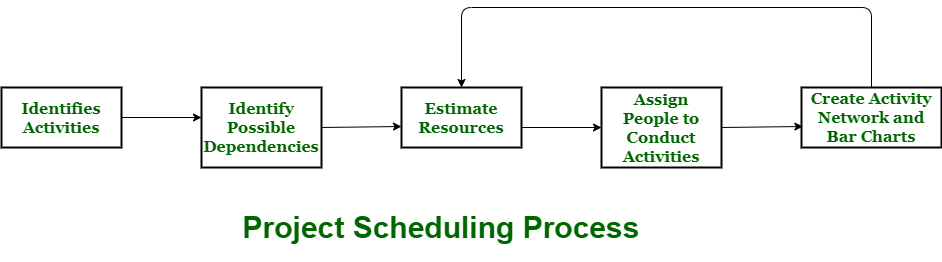
diagram explain project scheduling process.
Ans:
Project Scheduling Process - Explanation with Diagram
What is Project Scheduling?
Project Scheduling is a crucial step in project management that involves planning, organizing, and managing tasks to ensure the successful completion of a project within the defined time, budget, and resources.
Project Scheduling Process – Step-by-Step Explanation
The diagram above represents the key steps in the Project Scheduling Process:
-
Identify Activities
- The first step is to list and define all the tasks required to complete the project.
- This includes analyzing project objectives, scope, and deliverables.
-
Identify Possible Dependencies
- Identify relationships between different activities.
- Some tasks depend on the completion of others before they can begin (predecessor-successor relationships).
- This step helps in proper sequencing and logical order of tasks.
-
Estimate Resources
- Assess the resources (human, financial, materials, equipment, and time) required for each activity.
- Allocate necessary resources efficiently to prevent bottlenecks.
-
Assign People to Conduct Activities
- Allocate specific team members to different tasks based on their skills and expertise.
- Clearly define responsibilities to avoid confusion.
-
Create Activity Network and Bar Charts
- Develop an Activity Network Diagram (AND) to visualize dependencies.
- Use Gantt Charts or Bar Charts for better scheduling and time estimation.
- Identify critical paths to optimize project completion time.
-
Feedback and Adjustments (Loop back to previous steps)
- If required, revise the schedule based on constraints such as resource availability, risk factors, and unforeseen issues.
b.
Enlist
advantages and disadvantages of data centered architecture
Ans:
Advantages of Data-Centered Architecture
-
Data Consistency: Since all applications access the same centralized data source, there is a high level of data consistency, which minimizes the risk of data duplication and inconsistencies across different systems.
-
Simplified Data Management: Centralized control makes it easier to manage, maintain, and secure the data. Updates and changes can be made in one place, ensuring all applications see the most up-to-date data.
-
Easier Data Sharing: With a central repository, data sharing between different applications or services is simplified, as all can access the same data store without the need for complex integrations.
-
Efficient Data Backup and Recovery: Having a centralized data store streamlines backup procedures, as there is only one data set to back up, which can simplify recovery processes in case of data loss.
-
Improved Security: Centralized data storage allows for better security measures to be implemented, such as access controls and encryption, ensuring that sensitive data is protected more effectively.
-
Support for Analytics and Reporting: A centralized repository can facilitate better data analytics and reporting capabilities, providing a unified view of the data across different applications.
Disadvantages of Data-Centered Architecture
-
Single Point of Failure: The central data repository creates a single point of failure. If the central data store becomes unavailable due to system failure or maintenance, all applications relying on it may be affected.
-
Scalability Issues: As the data volume grows and the number of users increases, the centralized system may face performance bottlenecks, making it difficult to scale effectively.
-
Complexity in Data Retrieval: Applications may need to perform complex queries to retrieve data from the central repository, which could lead to performance issues if not managed properly.
-
Inflexibility: Changes in database schema or the central data structure can affect all applications using the data; thus, all dependent systems may require updates, leading to increased development time and costs.
-
Potentially High Overhead: The centralized data store must be capable of handling multiple requests simultaneously. This can involve considerable resource consumption and may require specialized database management systems.
-
Network Dependency: Data-centered architecture is heavily reliant on network availability and reliability. Any network outages can disrupt access to the shared data store.
c.
How
function point plays an important role in determining cost of Software systems.
Ans:
Function points are a standardized unit of measurement used to estimate the size and complexity of software applications. They provide a method to quantify the functional requirements of a system, which is essential for project estimation, including cost, time, and resource allocation. Here’s how function points play an important role in determining the cost of software systems:
1. Objective Measurement of Software Size
Function points offer an objective way to measure the size and complexity of a software application based on its functional requirements. This measurement serves as a basis for cost estimation, eliminating subjective biases that can occur when relying solely on subjective methods or historical data.
2. Predicting Effort and Time
Once the number of function points is calculated, it can be used in predictive models to estimate the amount of effort (in person-hours or effort) required to develop the software. For example, metrics such as COCOMO (Constructive Cost Model) use function points to gauge how long a software project will take to complete based on the estimated number of function points.
3. Cost Estimation
Cost estimation can be derived from the effort estimates. By determining the cost per hour of manpower and multiplying it by the estimated effort (calculated from function points), organizations can establish a clearer picture of the overall project costs. This approach helps ensure that budgets are realistic and aligned with the expected development effort.
4. Assessment of Complexity
Function points also take into account various factors that contribute to a system’s complexity, such as the number of inputs, outputs, user interactions, and internal and external interfaces. By understanding the complexity involved, organizations can better assess potential risks and their impact on project costs.
5. Benchmarking and Comparison
Function points allow organizations to compare similar projects or applications. By analyzing historical data on similar projects measured in function points, organizations can derive benchmarks for estimating new projects, improving the accuracy of cost predictions.
6. Support for Agile Methodologies
In agile environments, function points can help teams understand the scope of work required in each iteration or sprint. Teams can estimate the cost of delivering specific functional requirements based on their function point analysis, aiding in sprint planning and budget allocation.
7. Enhancing Project Management and Resource Allocation
Function points facilitate better project management by providing a clear quantitative measurement of what needs to be developed. This measurement helps project managers allocate resources appropriately and manage timelines more effectively.
d. Define system design ,explain its need and importance.
Ans:
Definition of System Design
System design refers to the process of defining the architecture, components, modules, interfaces, and data for a system to satisfy specified requirements. It translates customer requirements into a blueprint for the development and implementation of a system, ensuring that it meets the functional and non-functional needs of its users. System design can be categorized into high-level design (also known as architectural design) and low-level design (detailed design).
-
High-Level Design: This phase outlines the overall structure of the system and its components, defining how they interact with each other and how they fit within the overall system architecture.
-
Low-Level Design: This phase focuses on the detailed implementation of each component, including algorithms, data structures, and interfaces, essentially providing the specifics needed for coding.
Need for System Design
-
Transformation of Requirements into Specifications: System design enables the transformation of high-level user requirements into detailed specifications that can be understood by developers and engineers. It bridges the gap between conceptual ideas and practical implementation.
-
Optimal Resource Allocation: By providing a clear design, organizations can efficiently allocate resources, both human and technical, throughout the development process. It helps in determining what technologies, tools, and techniques are needed to build the system.
-
Risk Mitigation: System design helps in identifying potential risks and challenges early in the development phase. By assessing the design, teams can foresee issues and adapt designs to mitigate those risks, leading to a more robust software application.
-
Facilitates Communication: A well-defined system design acts as a communication tool among stakeholders, including developers, project managers, and clients. It ensures that everyone has a clear understanding of the system, leading to more effective collaboration.
-
Improves Quality: Comprehensive system design results in fewer defects and higher-quality software. By carefully planning the architecture and components, the system is more likely to meet user expectations and perform efficiently.
Importance of System Design
-
Blueprint for Development: System design serves as a blueprint for the development team, guiding them through the coding and implementation phases. It provides clear instructions on how to build and integrate different system components.
-
Cost and Time Efficiency: Effective system design can lead to significant time and cost savings during development. By identifying and addressing issues during the design phase, teams can avoid costly rework and delays later in the project lifecycle.
-
Scalability and Flexibility: A well-architected system design allows for scalability, enabling the system to grow and adapt to changing requirements. It ensures that the system can handle increased loads and additional functionality without major redesigns.
-
Maintenance and Upgradability: Systems designed with maintainability in mind are easier to update and modify in the future. This is essential as business needs evolve and new technologies emerge, allowing organizations to stay competitive.
-
Performance Optimization: Through system design, developers can optimize system performance by carefully selecting algorithms, data structures, and server configurations, leading to faster response times and enhanced user satisfaction.
e.
Write
short note on COCOMO Model.
Ans:
COCOMO Model
Definition: COCOMO (Constructive Cost Model) is a mathematical model developed by Barry Boehm in the early 1980s for estimating the cost, effort, and schedule for software projects. It is widely used in the software engineering field to assist project managers in predicting project outcomes based on various project attributes.
Key Features of COCOMO
-
Estimation of Software Development Effort: COCOMO provides a formula for estimating the total effort required (measured in person-months) based on the size of the software, typically expressed in lines of code (LOC) or function points.
-
Different Modes of Estimation: COCOMO consists of three main models that cater to different types of projects:
- Basic COCOMO: A simple model that uses a linear regression equation based on project size. It is suited for small to medium-sized projects.
- Intermediate COCOMO: An enhancement of the basic model, which incorporates additional cost factors that affect project effort, such as team experience, technology use, and project complexity.
- Detailed COCOMO: The most comprehensive model that includes all the factors from the intermediate model and further breaks down project components into smaller, more manageable components, allowing for a more granular estimate.
- Cost Driver Factors: The model considers several cost drivers that can impact software development costs and effort. These include product attributes (e.g., reliability and complexity), project attributes (e.g., required development time and project team experience), and hardware attributes.
Importance of COCOMO
-
Improved Accuracy: By providing a structured approach to cost estimation, COCOMO helps organizations achieve more accurate predictions regarding software project costs and timelines than relying on intuition or historical data alone.
-
Project Management Tool: COCOMO serves as a valuable tool for project managers to plan, budget, and allocate resources effectively, ultimately enhancing project success rates.
-
Benchmarking: Organizations can use COCOMO estimates to benchmark similar projects and assess performance against industry standards, leading to improved processes over time.
-
Scalability: The model can be adapted for various types of projects and provides flexibility for teams of different sizes and experience levels.
f.
Explain
process of verification for design of Software systems.
Ans:
Process of Verification for Design of Software Systems
Verification is a crucial process in the software development lifecycle that ensures the software design meets its specified requirements and functions correctly before implementation. The goal is to identify and rectify any discrepancies between the design and the requirements early in the development process, thus minimizing the risk of defects and failures in the final product.
Steps Involved in the Verification Process
- Requirements Review:
- Objective: Ensure that all requirements (both functional and non-functional) are clearly defined, complete, and feasible.
- Activities: Review the requirements document with stakeholders to confirm understanding, address ambiguities, and validate that all necessary requirements have been captured.
- Design Review:
- Objective: Analyze the design documents to ensure they meet the agreed requirements and specifications.
- Activities: Conduct design walkthroughs or inspections involving stakeholders, developers, and designers. This step includes examining architectural designs, interface designs, and detailed design specifications to verify adherence to the requirements.
- Static Analysis:
- Objective: Identify potential errors in the design without executing the program.
- Activities: Utilize tools for static analysis to review design documents and code (if available). This may involve checking for compliance with coding standards, structural issues, and documentation quality.
- Model Verification:
- Objective: Validate that design models correctly represent the system functionality.
- Activities: Use modeling techniques (UML diagrams, state diagrams, etc.) to visualize the system design and verify that it correctly represents the system requirements. Tools such as formal verification methods or model checking can be employed to mathematically prove properties about the design.
- Prototype Evaluation:
- Objective: Test the design through a functional prototype to gather feedback.
- Activities: Develop a prototype based on the design to allow stakeholders to interact with it and evaluate whether it meets their requirements and expectations. This iterative approach allows for adjustments based on user feedback.
- Traceability Analysis:
- Objective: Ensure that every requirement is addressed in the design.
- Activities: Create a traceability matrix that connects each requirement to its corresponding design elements. This facilitates verification and ensures that no requirements are overlooked in the design phase.
- Review Against Standards and Guidelines:
- Objective: Confirm compliance with industry and organizational standards.
- Activities: Check the design against relevant standards (e.g., ISO, IEEE) and organizational guidelines to ensure best practices are followed.
- Cross-Disciplinary Review:
- Objective: Validate the design from multiple perspectives.
- Activities: Engage professionals from different disciplines (e.g., development, testing, architecture, and QA) in a cross-functional review to identify any potential issues not captured in previous reviews.
- Final Verification Approval:
- Objective: Achieve consensus on the design’s readiness for implementation.
- Activities: Conduct a final review meeting with stakeholders to confirm that all verification activities have been completed, issues have been resolved, and the design is approved for the next phase of development.
Importance of Verification in Software Design
- Error Detection: Early identification of discrepancies reduces the risk of costly fixes during the later stages of development or after deployment.
- Quality Assurance: Ensures that the software is built according to specifications, ultimately leading to higher quality end-products.
- Stakeholder Confidence: Involves stakeholders in the verification process, fostering trust that the project is on track and aligned with their expectations.
- Risk Management: Helps anticipate and manage potential risks associated with the design, ensuring the software is robust.
g.
Explain call return architecture types.
Ans:
Call-Return Architecture Types
Call-return architecture is a software architectural style characterized by the organization of program components in a hierarchical structure that allows components to call one another in a defined sequence, and subsequently return control to the calling component. This architecture is commonly used in procedural programming languages and resembles the way functions and procedures work in many programming environments.
The following are common types of call-return architectures:
1. Procedural Call-Return
-
Description: This is the most fundamental form of call-return architecture. It involves the use of functions or procedures where control is transferred to a procedure when it is called, and upon its completion, control returns to the caller.
-
Characteristics:
-
Simple to understand and implement.
-
Functions can take parameters and return values.
-
Supports modular programming as developers can implement reusable code.
-
Example: In languages like C or Pascal, functions are defined and called, allowing for structured program flow.
2. Recursive Call-Return
-
Description: A special case of the procedural call-return where a function calls itself, either directly or indirectly, to solve a problem by breaking it down into smaller sub-problems.
-
Characteristics:
-
The recursive function has a base case that terminates recursion and prevents infinite loops.
-
Commonly used in divide-and-conquer algorithms like quicksort, mergesort, or calculating factorial numbers.
-
Example: A function that computes the Fibonacci sequence can call itself to calculate previous Fibonacci numbers until reaching the base case.
3. Remote Procedure Call (RPC)
-
Description: This architecture enables a program to cause a procedure to execute in another address space (commonly on a different computer in a distributed system) as if it were a local procedure call.
-
Characteristics:
-
Simplifies the process of executing functions across network boundaries.
-
Abstracts the details of the communication, making remote calls similar to local calls from the programmer's standpoint.
-
Example: An application server providing a service (e.g., weather data or payment processing) can be queried by a client application through RPC.
4. Service-Oriented Architecture (SOA)
-
Description: In this architecture, services communicate with each other over a network using well-defined protocols. Each service can call other services, and upon completion, return results back to the calling service.
-
Characteristics:
-
Promotes reusability and interoperability among distributed systems.
-
Encourages loose coupling between services, enabling flexible systems.
-
Example: A retail application might have separate services for inventory management, order processing, and payment handling that communicate through RPC or message queues.
5. Microservices Architecture
-
Description: A variant of service-oriented architecture, where an application is structured as a collection of loosely coupled services that can be developed, deployed, and scaled independently.
-
Characteristics:
-
Each microservice can call other microservices as required.
-
Promotes continuous integration and deployment.
-
Services can be implemented in different programming languages and can be deployed on different platforms.
-
Example: An e-commerce platform may consist of microservices for user authentication, product catalog, shopping cart, and payment processing, each capable of being called independently.
6. Stack-Based Call-Return
-
Description: In stack-based architectures, function calls are managed using a call stack, which is a data structure that holds information about active subroutines of a computer program.
-
Characteristics:
-
Supports nested function calls through Last In, First Out (LIFO) principle.
-
Automatic handling of return addresses and local variables via the stack.
-
Example: Programming languages like C and C++ utilize a call stack to handle function calls and variable scopes.
h.
Explain low level and high level design.
Ans:
Low-Level Design (LLD) and High-Level Design (HLD)
In software engineering, design is a crucial phase in the Software Development Life Cycle (SDLC), where the system's architecture is defined and specified. This design phase is typically divided into two levels: High-Level Design (HLD) and Low-Level Design (LLD). Both serve distinct purposes in the overall design process.
High-Level Design (HLD)
Definition: High-Level Design refers to the initial design stage, where the overall system architecture is outlined. It focuses on the system's architecture and the relationships between various components.
Characteristics:
- Abstract View: HLD provides a bird’s-eye view of the entire system, detailing components and their interactions without going into detail about the internal mechanisms.
- Modules and Components: It identifies modules or components within the system and describes how these components interact with each other and with external systems.
- Technological Considerations: HLD outlines hardware and software requirements, technical architecture, and defines the technology stack to be used.
- System Modules: Each module's functions are defined, but the internal logic and implementation details are not specified.
Purpose:
- To provide a framework for the entire system.
- To facilitate communication among stakeholders (developers, designers, clients) regarding the overall system structure.
- To serve as a guide for the detailed design phase.
Example: In a banking system, the HLD might outline the following components:
- User Interface Module
- Account Management System
- Transaction Processing System
- Reporting Module
The HLD will indicate how these components interact (e.g., the User Interface Module communicates with the Account Management System and Transaction Processing System).
Low-Level Design (LLD)
Definition: Low-Level Design is the stage where the detailed specifications of the system's components are created. It translates the high-level architecture into detailed components, algorithms, and interfaces.
Characteristics:
- Detailed View: LLD provides a low-level perspective, focusing on how each individual module or component will work and how they will be implemented.
- Classes and Methods: It outlines the specific classes, data structures, methods, and their interactions, complete with algorithmic details.
- Data Flow: It describes the data flow between modules, providing sequence diagrams, class diagrams, and sometimes state diagrams.
- Integration Details: LLD specifies how different modules will be integrated, including APIs, protocols, and formatting for data exchange.
Purpose:
- To provide complete details for developers to begin coding.
- To ensure that the developers understand how to implement the individual components of the system.
- To specify unit testing strategies and validate the module's functionality.
Example: Continuing from the banking system example, the LLD might describe:
- The data structure for customer accounts (attributes like account number, balance, etc.)
- The specific methods within the Account Management System, such as
createAccount(),deposit(), andwithdraw(), including the algorithms for validating transactions and updating balances. - Class diagrams showing the relationships between the Account class and other classes like User and Transaction.
i.
Explain top down and bottom approach.
Ans:
Top-Down Approach
Definition: The top-down approach is a design methodology that initiates system development from the highest level of abstraction, progressively breaking it down into smaller and more detailed components or modules.
Characteristics:
- Hierarchical Decomposition: The system is segmented into primary components, which are further divided into subcomponents, continuing until the smallest functional units are defined.
- Focus on Overall Functionality: There is an initial emphasis on the comprehensive functionality of the system, guiding the development process through an understanding of the interactions among high-level components.
- Process: Developers start with a broad concept of the system; they define requirements, design the overall architecture, and progressively refine and specify each individual component.
- Documentation: Each design level is accompanied by documentation such as flowcharts or diagrams that illustrate the relationships among components.
Advantages:
- Establishes a clear organizational structure for the entire system.
- Allows for early identification of potential system-wide issues.
- Promotes an ongoing review of system goals in relation to its components.
Disadvantages:
- Risks overlooking crucial details if the higher-level design lacks thorough consideration.
- Can lead to a rigid system structure that complicates adjustments needed after the high-level design is completed.
Example: For the development of an e-commerce application using a top-down approach:
- Begin by defining the overall requirements (e.g., user accounts, product catalogs, shopping carts).
- Break down the system into major components (e.g., User Management Module, Product Management Module, Order Processing Module).
- Further dissect each module into sub-modules (e.g., the User Management Module could include registration and login functionalities).
Bottom-Up Approach
Definition: The bottom-up approach is a design methodology that constructs the system starting from the smallest components, which are then integrated to form larger modules and ultimately the complete system.
Characteristics:
- Component Integration: Development begins with the creation of fundamental building blocks (such as individual functions or classes) that are subsequently combined to constitute higher-level modules.
- Focus on Details: There is a primary concentration on the intricate details of software components initially, with less focus on the overarching system during the early phases.
- Process: Developers independently create and test smaller modules, which are later integrated into a cohesive system architecture.
- Documentation: Comprehensive documentation is necessary at the component level and may be adjusted to illustrate how components are integrated.
Advantages:
- Offers increased flexibility and capacity for adaptation, enabling changes to specific components without impacting the entire system.
- Fosters innovation, allowing developers to build upon existing components.
j.
Define cost estimation process and list its various parameters.
Ans:
Cost Estimation Process
The cost estimation process in software engineering involves evaluating the expenses associated with the development, operation, and maintenance of software projects. This process is crucial as it helps project managers and stakeholders to forecast budgets, allocate resources effectively, and manage financial aspects throughout the project lifecycle. The typical steps in the cost estimation process are as follows:
-
Requirement Analysis: Gather and analyze project requirements to understand scope and functionality. This step is critical for determining what features and resources will be needed.
-
Identifying Estimation Techniques: Choose appropriate estimation techniques based on project characteristics. Common techniques include expert judgment, analogous estimation, parametric estimation, and bottom-up estimation.
-
Resource Identification: Identify all resources necessary for the project, including personnel (developers, testers, managers), hardware, software licenses, and infrastructure.
-
Cost Breakdown: Develop a detailed breakdown of costs by categorizing expenses into labor, hardware, software, overhead, and contingency funds.
-
Estimation Calculation: Apply the chosen estimation techniques to calculate costs. This can involve using historical data, formulas, or templates tailored for specific project types.
-
Review and Validate: Review the estimated costs with stakeholders and validate assumptions. This step ensures that all aspects have been considered and that estimates are realistic.
-
Documentation: Document the estimation process, including assumptions, methodologies used, and rationale for chosen costs. This documentation serves as a reference for future estimations and project audits.
-
Monitoring and Adjustment: As the project progresses, continuously monitor costs against the estimates and adjust as necessary to reflect changes in scope, resource availability, or other factors.
Parameters of Cost Estimation
Several parameters influence the cost estimation process in software projects:
-
Project Size: This includes the number of features, lines of code, or function points which directly impact the overall effort and resources required.
-
Complexity: The complexity of the software being developed affects both the development time and the skill level of the required personnel, impacting costs.
-
Team Experience: The experience and skill levels of the development team influence efficiency and productivity, thereby affecting labor costs.
-
Technology and Tools: The choice of technology stack and development tools can vary significantly in cost, including licensing fees for software and hardware requirements.
-
Development Methodology: The cost estimation may vary significantly depending on whether agile, waterfall, or other methodologies are used, as these affect project length and resource allocation.
-
Location: Geographic considerations can impact wage expectations, resource availability, and costs associated with project management and collaboration.
-
Timeframe: The urgency of the project affects resource allocation and can lead to increased costs if expedited development is required.
-
Quality Requirements: Higher quality requirements, including performance, compliance, and security standards, typically increase development and testing efforts and thus costs.
-
Maintenance and Support: Consideration of ongoing costs for software maintenance, updates, and user support as part of the overall project budget.
k.
Write short notes on structure charts.
Ans:
Structure Charts
Definition: Structure charts are visual representations used in software engineering to depict the hierarchical structure of a system, showcasing its components, interactions, and decomposition. They provide a clear overview of how the software system is organized and how functions are related to each other.
Purpose: The primary purpose of structure charts is to illustrate the architecture of a system or module, focusing on the relationships and interfaces between components. This facilitates better understanding among developers, stakeholders, and project managers regarding how different parts of the system interact and function together.
Key Features:
-
Hierarchical Representation: Structure charts break down a complex system into manageable parts by presenting a top-down view, where major functions are subdivided into smaller sub-functions or processes. Each level represents a different level of abstraction.
-
Symbols and Notations:
- Boxes: Each box represents a function or module.
- Connecting Lines: Lines indicate relationships or communication pathways between modules.
- Directional Arrows: These arrows illustrate data flow or control flow between modules, indicating which module calls another.
-
Modularity: Each function or module is designed to perform a specific task, promoting modular programming. This allows for easier maintenance, updates, and testing of individual components without affecting the entire system.
-
Control Structure: Structure charts also show the call hierarchy, specifying which module invokes another and the sequence of calls, thereby clarifying control flows within the system.
-
Data Flow: They typically emphasize how data is passed between modules, which is key for understanding system interactions and dependencies.
l.
Define metrics and explain the need of Software metrics in
Software designing.
Ans:
Metrics in the context of software engineering refer to quantitative measures that are used to assess various attributes or characteristics of software products, processes, or projects. These measurements help organizations evaluate several factors, such as quality, performance, productivity, and resource usage, thereby facilitating better decision-making and project management.
Types of Software Metrics
- Product Metrics: Measure attributes of the software product itself, such as:
- Lines of Code (LOC)
- Function Points (FP)
- Code complexity (e.g., Cyclomatic complexity)
- Defect density
- Process Metrics: Focus on various aspects of the software development process, such as:
- Time taken for different phases (e.g., requirements, design, coding, testing)
- Number of defects identified in different phases
- Productivity measures (e.g., the number of function points developed per month)
- Project Metrics: Pertaining to the overall software project management, including:
- Budget adherence
- Schedule variance
- Resource allocation and utilization
Need for Software Metrics in Software Designing
-
Objective Assessment: Software metrics provide an objective basis for evaluating the quality and effectiveness of software products and processes. This objectivity removes ambiguity and helps in making informed decisions.
-
Quality Improvement: By measuring various aspects of software quality, such as defect density or cyclomatic complexity, teams can identify weaknesses in the code and focus on improving those areas. Metrics can highlight trends that require attention, allowing for proactive quality management.
-
Performance Monitoring: Metrics allow teams to monitor critical performance indicators over time, such as response time, throughput, and resource usage. This data is essential for assessing whether software meets its performance requirements.
-
Cost Management: By tracking and analyzing metrics related to development costs, teams can better manage budgets and resources. Metrics enable more accurate cost estimation by providing historical data based on past projects.
-
Enhanced Communication: Metrics serve as a common language among team members, management, and stakeholders. Well-defined metrics can facilitate discussions about progress, issues, and performance without ambiguity.
-
Benchmarking: Metrics allow organizations to establish benchmarks for their projects, which can then be used for comparing performance across different teams, projects, or over time. This aids in identifying best practices and areas for improvement.
-
Process Improvement: By analyzing process metrics, teams can identify inefficiencies or bottlenecks in their workflows, allowing for continual process improvement and optimization. This can lead to shorter development cycles and reduced costs.
m.
Explain Software product and process metrics with examples.
Ans:
Software Product Metrics
Definition: Software product metrics are quantitative measurements that assess the attributes of a software product. These metrics help evaluate various aspects of the software, including quality, performance, functionality, and maintainability.
Examples of Software Product Metrics:
- Lines of Code (LOC):
- Description: Measures the size of the software by counting the number of lines of executable code.
- Example: A project with 10,000 lines of code can help estimate the complexity and effort required for maintenance.
- Defect Density:
- Description: Calculates the number of defects confirmed in the software relative to its size, typically measured per thousand lines of code (KLOC).
- Example: If a software application has 100 defects and consists of 20,000 lines of code, the defect density would be defects per KLOC.
- Function Points (FP):
- Description: A measure of software functionality based on the logical design of the system. It quantifies the functional specifications based on the user requirements.
- Example: A system that requires 10 user inputs, has 5 outputs, 3 inquiries, and 2 files would have a calculated function point metric that reflects its complexity and functional size.
- Code Complexity:
- Description: Measures the complexity of the code, often using metrics like Cyclomatic Complexity, which quantifies the number of linearly independent paths through the program.
- Example: A function with a Cyclomatic Complexity of 10 indicates 10 possible paths of execution, suggesting higher complexity and potential difficulty in testing and maintaining the code.
- Mean Time to Failure (MTTF):
- Description: Measures the average time that a software product operates without failure, reflecting its reliability.
- Example: If a software application runs for an average of 200 hours before encountering a failure, its MTTF is 200 hours.
Software Process Metrics
Definition: Software process metrics are quantitative measures that evaluate the effectiveness, efficiency, and quality of the software development processes. These metrics help in the assessment and improvement of the processes used in creating software.
Examples of Software Process Metrics:
- Cycle Time:
- Description: The total time taken for a development cycle, from requirement gathering to deployment.
- Example: If a project takes 6 months from inception to delivery, its cycle time is 6 months.
- Defect Removal Efficiency (DRE):
- Description: Measures the efficiency of the defect detection and removal processes. It is calculated as the ratio of defects found before release to the total number of defects (those found before and after release).
- Example: If 40 defects were found during testing and 10 defects were found after release, the DRE would be or 80%.
- Cost per Function Point:
- Description: The total cost involved in developing the software divided by the number of function points.
- Example: If a project costs 200,000andhas200functionpoints,thecostperfunctionpointwouldbe \frac{200,000}{200} = $1,000 $.
- Productivity:
- Description: A measure of the amount of work produced by a team, often calculated as the number of function points or lines of code produced per staff month.
- Example: If a team produces 500 function points in one month with 5 team members, the productivity would be .
- Schedule Variance (SV):
- Description: A measure of how much ahead or behind schedule a project is at a specific point in time, calculated as the difference between the planned progress and actual progress.
- Example: If a project was planned to complete 60% of its work by the current date but has only completed 50%, the Schedule Variance would be , indicating a delay.
Comments
Post a Comment